
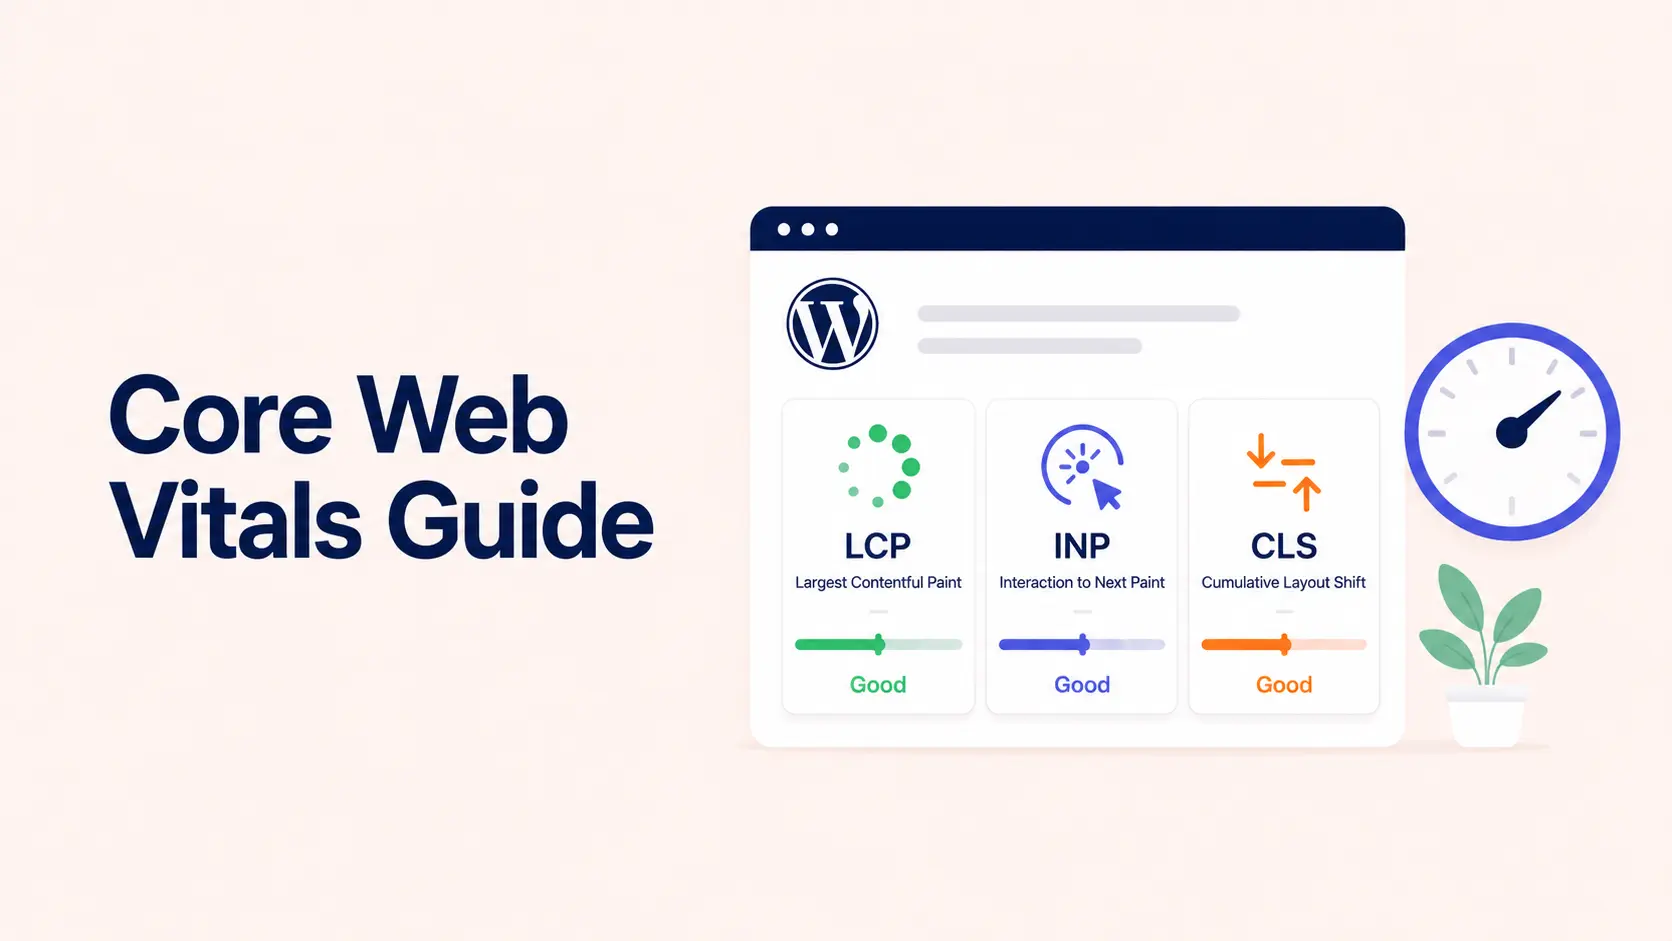

A Core Web Vitals audit should answer three questions: How quickly does the main content appear? How quickly does the page respond when a user interacts? Does the layout stay visually stable? Google measures those experiences with Largest Contentful Paint (LCP), Interaction to Next Paint (INP), and Cumulative Layout Shift (CLS).
For a page to have good Core Web Vitals, aim for LCP of 2.5 seconds or less, INP of 200 milliseconds or less, and CLS of 0.1 or less at the 75th percentile of visits. Those are field thresholds based on real-user experience, not targets you should judge from a single Lighthouse run.
This guide focuses on the fixes that directly improve those three metrics.
TL;DR
- LCP measures how quickly the largest visible content element renders. Improve it by reducing server delay, discovering the LCP resource earlier, optimizing that resource, and removing render delays.
- INP measures responsiveness across user interactions. Improve it by reducing long main-thread tasks, unnecessary JavaScript, heavy event work, and rendering/layout work after interactions.
- CLS measures unexpected visual movement. Improve it by reserving space for images, embeds, ads, and dynamic content; stabilizing fonts; and avoiding layout-changing animations.
- Use field data first from PageSpeed Insights, Chrome UX Report, Search Console, or real-user monitoring. Use lab tools to reproduce and diagnose the cause.
- Do not chase a perfect Lighthouse score. Fix the pages and interactions that real users actually experience.
Core Web Vitals Thresholds
| Metric | Good | Needs improvement | Poor | Measures |
|---|---|---|---|---|
| LCP | ≤ 2.5 s | > 2.5 s to 4.0 s | > 4.0 s | Loading performance |
| INP | ≤ 200 ms | > 200 ms to 500 ms | > 500 ms | Interaction responsiveness |
| CLS | ≤ 0.1 | > 0.1 to 0.25 | > 0.25 | Visual stability |
Google evaluates these thresholds at the 75th percentile, segmented by mobile and desktop. In practical terms, a page is not “good” because one fast test passed; most real visits need to meet the target.
Google also states that Core Web Vitals are used by its ranking systems, but good scores do not guarantee top rankings. Relevance and overall page experience still matter. Treat Core Web Vitals primarily as user-experience metrics with SEO value, not as a shortcut to rankings.
Measure Core Web Vitals Correctly Before You Optimize
Start with field data. Core Web Vitals are designed to measure real-world experience, and device speed, network conditions, geography, caching, page state, and user behavior can all change the result.
Useful field sources include:
- PageSpeed Insights, which can show Chrome User Experience Report (CrUX) data when enough field data exists;
- Google Search Console → Core Web Vitals, useful for finding groups of URLs with similar problems;
- CrUX or a real-user monitoring platform for deeper production data;
- the web-vitals JavaScript library if you want your own measurement and attribution.
Then reproduce the issue in lab tools such as Chrome DevTools, Lighthouse, or WebPageTest.
One important limitation: Lighthouse does not directly measure INP in its normal synthetic test because there is no real user interaction. Total Blocking Time (TBT) is commonly used as a lab proxy, while slow real interactions should be reproduced manually in DevTools.
Field and lab numbers can differ. That is normal. Use field data to decide what matters and lab data to understand why it is happening.
How to Improve LCP
LCP measures when the largest image, text block, or other eligible content element in the initial viewport finishes rendering. On many business websites, the LCP element is the hero image, hero heading, banner, or another above-the-fold element.
The fastest way to fix LCP is to identify which part of the loading chain is consuming the time.
1. Reduce Time to First Byte
The browser cannot render the main content until it receives the document.
High server response time can come from slow hosting, uncached dynamic pages, expensive database queries, remote API calls, overloaded infrastructure, or inefficient application code.
Prioritize:
- full-page caching where the page can be cached;
- server-side/object caching where appropriate;
- current PHP/runtime versions and sufficient server resources;
- database/query profiling on slow dynamic pages;
- avoiding unnecessary synchronous API work during page generation;
- a CDN or edge caching strategy when it fits the site.
On WordPress, a slow LCP can begin before the browser sees the hero image. If PHP, database queries, plugins, or WooCommerce logic delay the initial HTML, image optimization alone will not solve the problem.
2. Make the LCP Resource Discoverable Early
Google’s LCP guidance emphasizes reducing resource load delay. If the browser discovers the LCP image late, the download starts late even when the image itself is optimized.
For an LCP image:
- include it in the initial HTML when possible;
- avoid injecting it late with JavaScript;
- do not lazy-load an above-the-fold LCP image;
- use preload or fetchpriority=”high” selectively when the browser otherwise prioritizes it too late;
- avoid hiding the real hero image behind a CSS background or script when a normal responsive image is more appropriate.
Check the Network waterfall. The LCP resource should begin loading early rather than waiting behind noncritical assets.
3. Reduce LCP Resource Load Time
If the resource starts early but still downloads slowly, reduce its transfer cost.
For images:
- resize them to realistic display dimensions;
- use responsive srcset/sizes;
- compress appropriately;
- use efficient formats such as WebP or AVIF where supported by your workflow;
- serve media through an efficient CDN when it produces a measurable benefit.
Do not compress a hero image until it visibly degrades just to save a few kilobytes. The goal is the smallest asset that still meets the design requirement.
4. Reduce Element Render Delay
Sometimes the LCP resource has already downloaded but the browser cannot paint it.
Common causes include:
- render-blocking CSS;
- large stylesheets containing unused rules;
- web-font dependencies that delay text rendering;
- client-side rendering that waits for JavaScript;
- long main-thread tasks;
- animations or scripts that keep the LCP element hidden initially.
Use DevTools to separate resource loading time from render delay. If the image is downloaded at 1.5 seconds but LCP occurs at 3.5 seconds, reducing image size alone is unlikely to recover the missing two seconds.
How to Improve INP
INP measures how responsive a page feels when a user clicks, taps, or presses a key. It observes interactions throughout the visit and reports a high-latency interaction while accounting for outliers.
A slow INP usually means the browser’s main thread is too busy to process the input, run the event handlers, calculate the next frame, and paint the visual response quickly enough.
5. Find the Actual Slow Interaction
Do not optimize INP by looking only at page load.
Identify the interaction that produces poor latency:
- opening a mobile menu;
- adding a product to cart;
- changing a filter;
- submitting or validating a form;
- opening an accordion or modal;
- typing into search/autocomplete;
- switching tabs;
- interacting with a page while it is still loading.
Field RUM data is especially valuable for INP diagnosis because it can tell you which interaction caused the delay. Without RUM, reproduce common user flows manually in Chrome DevTools.
6. Break Up Long Main-Thread Tasks
Long JavaScript tasks prevent the browser from responding promptly.
Typical causes include large loops, heavy data processing, hydration work, page-builder scripts, analytics initialization, complex UI libraries, or too much work inside an event callback.
Improve responsiveness by:
- splitting long work into smaller tasks;
- yielding to the browser between chunks of noncritical work;
- moving suitable CPU-heavy processing to a Web Worker;
- delaying nonessential work until after the immediate interaction;
- loading features only where they are needed.
The goal is not “zero JavaScript.” It is to keep the main thread available when the user needs it.
7. Reduce Unnecessary JavaScript
Every script has a download, parse, compile, and execution cost.
Audit:
- unused theme or page-builder features;
- plugins loading scripts globally when they are needed on only a few pages;
- duplicate libraries;
- marketing tags;
- chat tools;
- heatmaps;
- A/B testing scripts;
- social widgets.
A script can be small in transfer size but expensive to execute. Check main-thread time, not only file size.
For WordPress sites, the plugin count itself is not the metric. Our guide on how many WordPress plugins are too many explains why execution cost and plugin behavior matter more than an arbitrary count.
8. Keep Interaction Handlers Small
A click handler that immediately performs several expensive tasks will make the interaction feel slow.
For example, a product filter might update state, rebuild a large DOM tree, recalculate layout, send analytics, update the URL, and render multiple components before the next paint.
Prioritize the visual response first. Defer secondary work when possible.
Avoid repeated synchronous layout reads and writes inside the same interaction, especially on large documents.
9. Reduce DOM and Rendering Work
INP includes more than JavaScript execution. The browser may also need to recalculate styles, run layout, and paint the result.
Large DOM trees, deeply nested components, expensive selectors, and massive page-builder structures can increase rendering work.
Simplify:
- hidden or duplicated markup;
- unnecessarily deep containers;
- large menus or filters rendered all at once;
- complex UI that updates far more elements than the interaction requires.
If an interaction changes one component, avoid forcing the browser to re-render or recalculate unrelated sections.
How to Improve CLS
CLS measures unexpected layout movement. It is unitless: 0.1 or less is good.
The most common causes documented in Google’s CLS optimization guidance involve elements whose space is not stable before they load or change.
10. Set Dimensions for Images and Video
Give images and video known dimensions or an aspect ratio so the browser can reserve space before the resource loads.
Responsive images can still scale fluidly. Width and height attributes establish the aspect ratio; CSS can then resize the element while preserving its reserved space.
This is one of the most reliable CLS fixes.
11. Reserve Space for Embeds, Ads, and Dynamic Components
Cookie banners, ad slots, social embeds, review widgets, maps, forms, recommendation blocks, and personalization can move existing content when inserted late.
Reserve enough space before they load.
If the final height varies, use a sensible min-height or stable container based on realistic content. Avoid inserting new content above what the user is already reading unless the change is directly triggered by the user’s action.
12. Stabilize Web Fonts
Font swaps can change text width, line breaks, and element height.
Reduce font-related shifts by:
- limiting unnecessary font families and weights;
- self-hosting or efficiently delivering critical fonts where appropriate;
- preloading only fonts required immediately;
- choosing fallback fonts with similar metrics;
- configuring font-display behavior intentionally.
Do not preload every font file. Excessive preload competes with more important resources and can hurt LCP.
13. Avoid Layout-Changing Animations
Animating top, left, margins, widths, or similar layout-affecting properties can cause movement and extra rendering work.
When the visual design allows it, prefer compositor-friendly transform and opacity animations.
Also distinguish an expected transition triggered by a user action from an unexpected shift that happens without the user’s intent. CLS is specifically concerned with unexpected visual instability.
Fix the Metric That Is Actually Failing
Do not apply every optimization to every site.
Use this priority model:
- Field LCP is poor: identify the LCP element, inspect server response, resource discovery, download time, and render delay.
- Field INP is poor: find the slow interaction, inspect main-thread tasks and event timing, then reduce the work required before the next paint.
- Field CLS is poor: record the layout shift, identify the moving elements and the element that caused the movement, then reserve space or stabilize the source.
- Re-test the same page or interaction in the lab.
- Deploy the change.
- Monitor field data as new real-user data accumulates.
A previous PageSpeed result is not proof that the problem is fixed in production. Core Web Vitals are field metrics, and CrUX/Search Console data updates over time.
For broader loading improvements outside these three metrics, use our 15 website speed optimization techniques as the companion guide.
WordPress Core Web Vitals: What to Check First
For WordPress, start with the component most likely to own the problem.
Poor LCP: check page caching, server response, the hero/LCP image, theme CSS, font loading, page-builder output, and above-the-fold scripts.
Poor INP: inspect theme and plugin JavaScript, page-builder interactions, WooCommerce/cart scripts, filtering/search interfaces, third-party tags, and large DOM structures.
Poor CLS: check featured/hero images without stable dimensions, cookie banners, embeds, ads, sliders, sticky headers, dynamically injected blocks, and font swaps.
Do not install several optimization plugins before you identify the bottleneck. More optimization layers can create overlapping caching, delayed-script, minification, or preload rules that make debugging harder.
If the underlying WordPress implementation is consistently heavy, the issue may be architectural rather than a missing cache setting. Tenfic’s WordPress website development guide covers planning performance as part of the build.
Common Core Web Vitals Mistakes
Optimizing only the homepage
Search Console often groups similar pages, but templates can behave differently. Test important service pages, landing pages, articles, product pages, category pages, and logged-in flows where relevant.
Treating Lighthouse as field data
Lighthouse is a controlled lab test. It is excellent for diagnosis, but it does not represent every user’s device, network, cache state, or interaction history.
Using TBT as if it were INP
TBT is useful for diagnosing main-thread blocking in the lab, but it is not the INP metric. INP depends on actual interactions.
Preloading too much
Preload is a prioritization tool, not a generic speed switch. Preloading too many fonts, scripts, and images can make the browser compete for bandwidth and delay the genuinely critical resource.
Hiding layout shifts instead of fixing the source
Artificially forcing fixed heights everywhere can create clipped content or huge blank spaces. Reserve realistic space and fix the component that changes unexpectedly.
Conclusion
Improving Core Web Vitals is easier when you stop treating them as one generic page-speed score.
For LCP, shorten the path from navigation to the main content: fast HTML, early resource discovery, efficient transfer, and minimal render delay.
For INP, keep the main thread responsive: find the slow interaction, reduce long tasks and unnecessary JavaScript, and limit the rendering work required before the next paint.
For CLS, make the layout predictable: reserve space, stabilize fonts and dynamic content, and avoid unexpected layout-changing animation.
Measure with real-user field data, diagnose with lab tools, fix the specific bottleneck, and then verify the result in production.
Frequently Asked Questions
What are the three Core Web Vitals?
The current Core Web Vitals are Largest Contentful Paint (LCP) for loading performance, Interaction to Next Paint (INP) for responsiveness, and Cumulative Layout Shift (CLS) for visual stability.
What is a good Core Web Vitals score?
At the 75th percentile of visits, aim for LCP of 2.5 seconds or less, INP of 200 milliseconds or less, and CLS of 0.1 or less.
Do Core Web Vitals affect Google rankings?
Google says Core Web Vitals are used by its ranking systems, but good scores do not guarantee high rankings. Relevance, content quality, and overall page experience still matter.
Why does PageSpeed Insights show different field and lab results?
Field data reflects real Chrome users across different devices, networks, locations, and sessions. Lab data uses controlled test conditions. Use field data to identify real problems and lab data to reproduce and diagnose them.
Does Lighthouse measure INP?
A normal Lighthouse synthetic audit does not directly measure INP because it has no real user interaction. Lighthouse reports Total Blocking Time (TBT), which is useful as a lab proxy for responsiveness. INP should be evaluated with field data or reproduced through actual interactions.
What usually causes poor LCP?
Common causes include slow server response, late discovery of the LCP resource, oversized images, render-blocking CSS or fonts, client-side rendering delays, and long main-thread work before the element can paint.
What usually causes poor CLS?
Common causes include images or embeds without reserved dimensions, dynamically inserted content, ad slots, banners, unstable web-font swaps, and animations that change layout.