
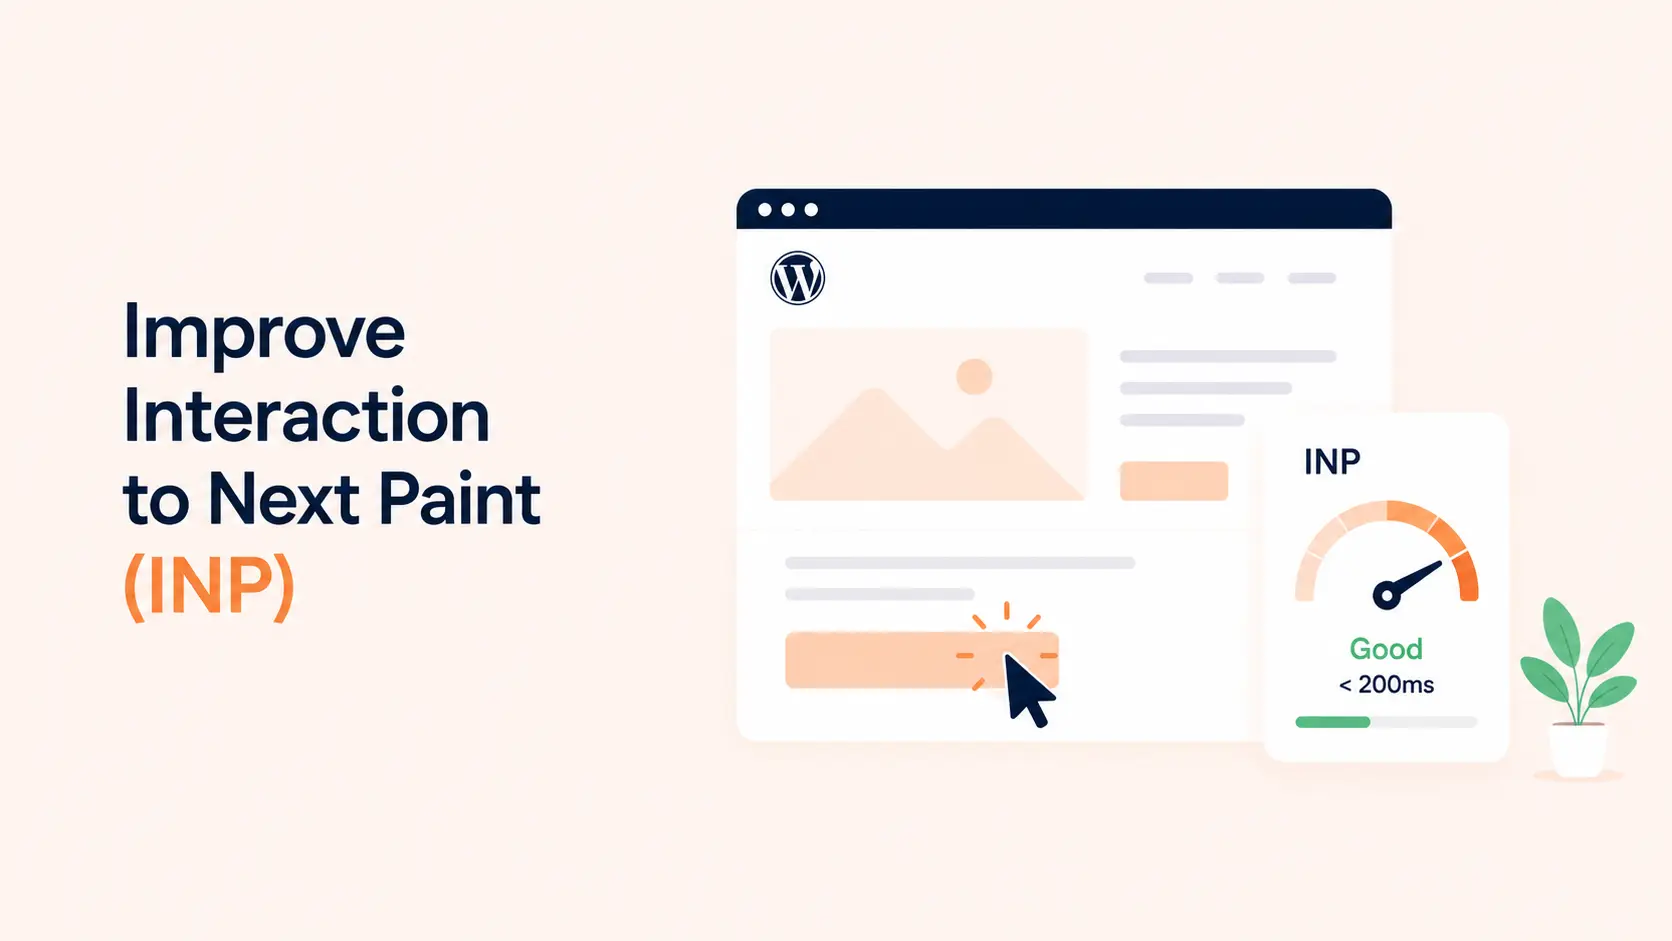

Interaction to Next Paint (INP) measures how responsive a page feels when someone clicks, taps, or types. If a button appears clickable but the page waits before reacting, a menu opens late, a filter freezes the interface, or typing feels delayed, INP is the Core Web Vital designed to capture that experience.
A good INP is 200 milliseconds or less at the 75th percentile. Between 200 and 500 ms needs improvement, while more than 500 ms is poor. A page can load quickly and still have poor INP once users begin interacting with it.
To improve INP, identify the slow interaction, determine where its delay occurs, and remove work from that part of the interaction.
TL;DR
To improve INP:
- find the actual slow clicks, taps, or keyboard interactions using field data and Chrome DevTools;
- reduce long tasks that block the main thread;
- keep event handlers small and move non-essential work until after the next paint;
- load less JavaScript and avoid running scripts on pages that do not need them;
- reduce expensive DOM updates, style recalculation, layout, and rendering work;
- delay or remove third-party scripts that compete for the main thread;
- use Web Workers for CPU-heavy work that does not require direct DOM access;
- on WordPress, audit plugins, page builders, tracking scripts, popups, filters, search, and other interactive features rather than blaming plugin count alone.
Caching, a CDN, and image compression can improve overall page speed, but they do not automatically fix poor INP. INP is primarily a responsiveness problem.
What Is Interaction to Next Paint?
INP is a Core Web Vital that measures the latency of user interactions during a page visit. It focuses on interactions initiated by clicks, taps, and keyboard input and measures how long the browser takes to present the next visual update.
INP replaced First Input Delay as a Core Web Vital in March 2024. Google recommends evaluating INP at the 75th percentile, separately for mobile and desktop users.
| INP | Rating |
|---|---|
| 200 ms or less | Good |
| More than 200 ms to 500 ms | Needs improvement |
| More than 500 ms | Poor |
The goal is not to make every interaction mathematically instant. The goal is to keep the page responsive for real users, including people on slower devices where heavy JavaScript and rendering work are more noticeable.
For the broader relationship between INP, LCP, and CLS, see Tenfic’s Core Web Vitals guide.
The Three Parts of INP You Need to Diagnose
A slow interaction can be divided into three parts. Knowing which part is large tells you what to fix.
1. Input delay
Input delay is the time between the user initiating an interaction and the browser beginning its event callbacks.
A common cause is a busy main thread. The user clicks while JavaScript, layout work, script evaluation, or another long task is already running, so the interaction has to wait.
Typical fix: reduce or split long tasks and remove unnecessary main-thread work.
2. Processing duration
Processing duration is the time the event callbacks themselves take to run.
A click handler that performs several calculations, updates many components, loops through a large dataset, triggers synchronous storage work, or executes several plugin scripts can make this part expensive.
Typical fix: keep the immediate event handler small and defer work that does not need to finish before the next visual response.
3. Presentation delay
Presentation delay occurs after event processing while the browser prepares and paints the next frame.
Large DOM changes, forced synchronous layout, complex styles, rendering large components, or excessive layout and paint work can make the user wait even after JavaScript finishes.
Typical fix: reduce rendering work and update only the part of the interface that actually needs to change.
The official web.dev INP optimization guidance uses this same three-part model.
How to Find What Is Causing Poor INP
Do not optimize INP from a Lighthouse score alone.
Start with field data
INP is fundamentally a field metric because it depends on real interactions. Chrome UX Report data in PageSpeed Insights can tell you whether a URL or origin is passing INP for real Chrome users.
If your site has enough traffic, real-user monitoring is even more useful because it can record the interaction target, page, device conditions, and latency associated with slow interactions.
Tenfic’s Google PageSpeed Insights guide explains the difference between field data and Lighthouse lab data in more detail.
Reproduce the interaction in Chrome DevTools
Once field data points to a problem, reproduce the slow interaction locally.
Open Chrome DevTools, record the Performance panel, perform the interaction, and inspect the Interactions track and main-thread activity. Chrome can show whether the delay came from waiting for the main thread, event processing, or rendering after the handler.
Test the interactions that matter to the business, such as:
- mobile navigation;
- product filters;
- search and autocomplete;
- add-to-cart actions;
- tabs and accordions;
- form fields and validation;
- popup or modal triggers;
- account dashboards;
- sorting and pagination.
A homepage with almost no interaction can have good INP while a product or application page performs poorly.
1. Break Up Long Main-Thread Tasks
Long tasks are one of the most common reasons an interaction waits before it can run.
A browser task that occupies the main thread for more than 50 ms is considered a long task. If a user interacts during that task, the browser may be unable to handle the input immediately.
The strongest fix is to perform less work. When necessary work is still too large, split it into smaller tasks so the browser gets opportunities to process user input and render updates between them.
Modern browsers support approaches such as scheduler.yield() for yielding to the main thread. Depending on browser requirements and application architecture, developers can also use task scheduling or other yielding patterns.
Prioritize long tasks that overlap with or delay real interactions.
2. Keep Event Handlers Small
An interaction should perform the minimum work needed to give the user immediate feedback.
For example, clicking “Add to cart” may need to change the button state immediately. Analytics, recommendation refreshes, non-critical UI updates, and other secondary work usually do not all need to finish before that feedback appears.
Move non-essential work until after the next paint or schedule it separately where the application allows it.
Also check for duplicate listeners or several plugins responding to the same interaction. One click can trigger more JavaScript than the visible feature suggests.
3. Load Less JavaScript
JavaScript affects INP in two ways: it can occupy the main thread before an interaction and it can make the interaction handler itself expensive.
Reduce code that users do not need on the current page. Useful techniques include:
- remove unused libraries and features;
- code-split large applications;
- conditionally load feature scripts;
- avoid site-wide assets for components used on only a few pages;
- replace unnecessarily heavy UI components when a simpler implementation provides the same result.
This is especially important on lower-powered mobile devices. A script that seems harmless on a fast desktop can create long tasks on a slower phone.
4. Reduce Third-Party Main-Thread Work
Analytics, advertising, chat, heatmaps, personalization, social widgets, A/B testing, consent tools, video embeds, and marketing automation can all execute JavaScript on the main thread.
Use DevTools to identify third-party code contributing to long tasks around slow interactions. Then decide whether the script can be removed, loaded later, limited to specific pages, or replaced with a lighter implementation.
Do not delay every third-party script blindly. Consent, payment, fraud prevention, accessibility, or business-critical tools can have functional requirements. Optimize according to what the script actually does.
5. Avoid Expensive DOM and Layout Work
JavaScript can finish quickly while the browser still spends too long calculating styles, laying out elements, and painting the next frame.
Common problems include:
- updating a large section of the DOM after a small interaction;
- repeatedly reading layout information and then writing styles in the same loop;
- rendering hundreds of hidden or off-screen elements;
- complex filters that rebuild an entire product grid;
- large mega menus or page-builder components with excessive nesting.
Update the smallest practical portion of the interface and avoid unnecessary layout recalculation.
A very large DOM is not automatically an INP failure, but it can make interaction-triggered rendering more expensive.
6. Give Visual Feedback Before Heavy Work
Users perceive an interface as more responsive when the visible reaction happens quickly.
If an operation takes longer, update the UI first when possible—for example, change a button state, show a loading indicator, open the shell of a panel, or reflect the user’s selection—then perform secondary work.
This must be real feedback, not a cosmetic trick that hides a frozen interface. The goal is to let the browser present the next meaningful frame without waiting for unrelated work.
7. Debounce or Throttle High-Frequency Work Carefully
Search boxes, filters, sliders, resize handlers, and other frequently triggered interactions can execute work repeatedly.
If a search request runs after every keystroke, debouncing can reduce duplicated work. If a handler reacts continuously to scroll or pointer movement, throttling may reduce how often expensive processing runs.
Use these techniques according to the interaction. An excessively long debounce delay can make the interface feel less responsive even if it reduces CPU usage.
8. Move CPU-Heavy Work Off the Main Thread
Web Workers can move suitable computation away from the main thread. This can help when the browser is doing CPU-heavy work that does not require direct DOM access.
Possible examples include parsing large datasets, complex calculations, or some data transformations.
Use Web Workers only when profiling shows substantial CPU work that can genuinely run separately from the main thread.
9. Optimize WordPress Plugins and Theme JavaScript
On WordPress, poor INP is often caused by what plugins and themes execute in the browser rather than by the number of plugins installed.
Look closely at:
- page builders and addon packs;
- sliders and animation libraries;
- AJAX filters and live search;
- popup and lead-generation tools;
- ecommerce variation selectors;
- chat and social widgets;
- analytics and marketing plugins;
- themes that load large interaction frameworks globally.
Disable a suspected feature on staging and reproduce the same interaction. If latency drops, investigate its configuration, conditional loading, alternative implementation, or replacement.
Tenfic’s guide on how many WordPress plugins are too many explains why plugin workload matters more than raw plugin count.
10. Do Not Expect Caching or Image Optimization to Fix INP by Themselves
Caching, a CDN, image optimization, and faster hosting are important for website performance, but INP is different from a loading metric such as LCP.
They can indirectly help when faster loading reduces main-thread or network contention during early interactions. But if clicking a filter triggers a 600 ms JavaScript task, compressing the hero image does not fix that handler.
Match the fix to the metric. For loading-focused work, see How to Speed Up a Website. For broader troubleshooting, see Why Is My Website Slow?.
A Practical INP Optimization Order
Use this order to avoid random changes:
- Confirm poor INP with field data.
- Identify the pages and interaction types involved.
- Reproduce a slow interaction in Chrome DevTools.
- Determine whether input delay, processing duration, or presentation delay dominates.
- Inspect the main-thread tasks and scripts around that interaction.
- Remove unnecessary work first.
- Split or defer remaining non-critical work.
- Reduce DOM/rendering work if presentation delay is high.
- Retest the same interaction under similar conditions.
- Monitor field INP after deployment because real-user data takes time to reflect changes.
This workflow is more reliable than chasing every performance warning at once.
Common INP Optimization Mistakes
Treating Total Blocking Time as INP
Lighthouse cannot reproduce every real user interaction, so lab tools often use Total Blocking Time as a useful responsiveness diagnostic. TBT and INP are related through main-thread blocking, but they are not the same metric.
Optimizing only page load
A page can become visually complete and then execute heavy scripts when the user opens a menu, filters products, submits a form, or interacts with a dashboard. Test the full user journey.
Removing useful functionality just to improve a metric
Performance optimization should preserve business requirements. First look for inefficient implementation, duplicate work, unnecessary global loading, and delayed secondary work before deleting a feature users need.
Testing only on a fast desktop
INP problems are often more visible on slower mobile CPUs. Use field data and realistic device conditions rather than relying entirely on a powerful development machine.
Conclusion
Improving INP means shortening the path from user input to the next visible response.
Start with the slow interaction itself. Determine whether it is waiting for the main thread, spending too long in JavaScript, or waiting for rendering. Then remove unnecessary work, split long tasks, simplify event handlers, reduce DOM updates, control third-party scripts, and move suitable CPU-heavy processing away from the main thread.
For WordPress sites, audit the JavaScript behavior of plugins, themes, page builders, filters, popups, analytics, and ecommerce features on the specific pages where poor interactions occur. A targeted fix based on profiling is far more effective than adding another general performance plugin.
Frequently Asked Questions
What is a good INP score?
A good Interaction to Next Paint score is 200 ms or less at the 75th percentile. More than 200 ms to 500 ms needs improvement, and more than 500 ms is poor.
What causes poor INP?
Common causes include long main-thread tasks, heavy JavaScript, expensive event handlers, large DOM updates, layout and rendering work, and third-party scripts competing for the main thread.
Does reducing JavaScript improve INP?
It often can. Less JavaScript can reduce main-thread blocking and event-processing work, but the important step is identifying which scripts and interactions are actually responsible for the delay.
Can a caching plugin improve INP?
Caching can improve overall loading performance and may reduce early-page contention, but it does not directly fix an expensive click handler or slow DOM update. Poor INP usually requires interaction-specific optimization.
How do I find slow interactions on my website?
Start with field INP data, then reproduce important interactions in Chrome DevTools Performance panel. Inspect the Interactions track and main-thread activity to see where the latency occurs.
Is INP the same as Total Blocking Time?
No. INP is a field Core Web Vital based on real interactions. Total Blocking Time is a lab metric that measures main-thread blocking during page load and can help diagnose responsiveness problems, but it is not INP.
How can I improve INP on WordPress?
Profile the affected interaction, then audit the plugins, theme, page builder, third-party scripts, and custom JavaScript involved. Reduce unnecessary main-thread work, load scripts only where needed, and simplify expensive interaction-triggered rendering.