

Google PageSpeed Insights is useful when you treat it as a diagnostic tool, not a scoreboard. A score of 96 does not automatically mean every visitor gets a fast experience, and a score of 68 does not tell you which fix matters most.
The report combines two different data sources: real-user performance data from the Chrome User Experience Report (CrUX) and a controlled Lighthouse lab test. Reading those sections separately is the key to understanding what is actually happening on a page.
This guide explains what every important PageSpeed Insights section means, why mobile and desktop results differ, how the performance score is calculated, and how to turn the report into a prioritized optimization plan.
TL;DR
Start with the real-user Core Web Vitals section. If the page has enough CrUX data, this tells you how actual Chrome users experienced it over the previous 28 days. A page passes Core Web Vitals only when LCP, INP, and CLS are all in the “good” range at the 75th percentile.
Then use the Lighthouse lab report to diagnose causes. The 0–100 performance score is a weighted lab score, not a direct SEO score. In the current Lighthouse scoring model, FCP, Speed Index, LCP, Total Blocking Time, and CLS contribute to the score. INP does not because a synthetic page load cannot reproduce the full range of real-user interactions.
Do not optimize every warning equally. Fix the bottleneck affecting real users first, then retest the same page several times under comparable conditions.
What Does Google PageSpeed Insights Actually Measure?
PageSpeed Insights evaluates a URL on mobile and desktop and combines two types of performance information:
- Field data: anonymized real-user data from CrUX.
- Lab data: a Lighthouse test run in a controlled environment.
These answer different questions.
Field data answers: How did real users experience this page recently?
Lab data answers: What happened during this specific simulated test, and what technical issues can we investigate?
You need both. Field data establishes whether a real problem exists. Lab data helps you reproduce and diagnose it.
Field Data vs Lab Data: The Most Important Difference
PageSpeed Insights can show very different numbers in the two sections without either section being wrong.
| Data type | What it represents | Best use |
|---|---|---|
| CrUX field data | Real Chrome users over the previous 28-day collection period | Validate real-world Core Web Vitals |
| Lighthouse lab data | One simulated test under controlled device/network conditions | Debug performance bottlenecks |
A visitor on a modern phone, fast Wi-Fi, and a warm cache may experience a page very differently from a Lighthouse mobile simulation. Real traffic also includes different locations, connection quality, device capability, cookies, logged-in states, experiments, ads, and third-party services.
This is why you should not try to force lab and field numbers to match.
How to Read the Real-User Experience Section
When enough CrUX data is available, PageSpeed Insights reports real-user metrics for the tested URL. Depending on data availability, you may also see origin-level information representing pages across the same site.
The three metrics that determine the Core Web Vitals assessment are:
| Metric | Good | Needs improvement | Poor |
|---|---|---|---|
| Largest Contentful Paint (LCP) | ≤ 2.5 s | > 2.5 s to 4.0 s | > 4.0 s |
| Interaction to Next Paint (INP) | ≤ 200 ms | > 200 ms to 500 ms | > 500 ms |
| Cumulative Layout Shift (CLS) | ≤ 0.1 | > 0.1 to 0.25 | > 0.25 |
Google evaluates these at the 75th percentile. In practical terms, a “good” LCP means at least 75% of measured page visits had an LCP at or below 2.5 seconds.
If any one of LCP, INP, or CLS fails the required threshold, the overall Core Web Vitals assessment does not pass.
For a deeper metric-by-metric optimization process, see Tenfic’s Core Web Vitals guide.
What Does the PageSpeed Performance Score Mean?
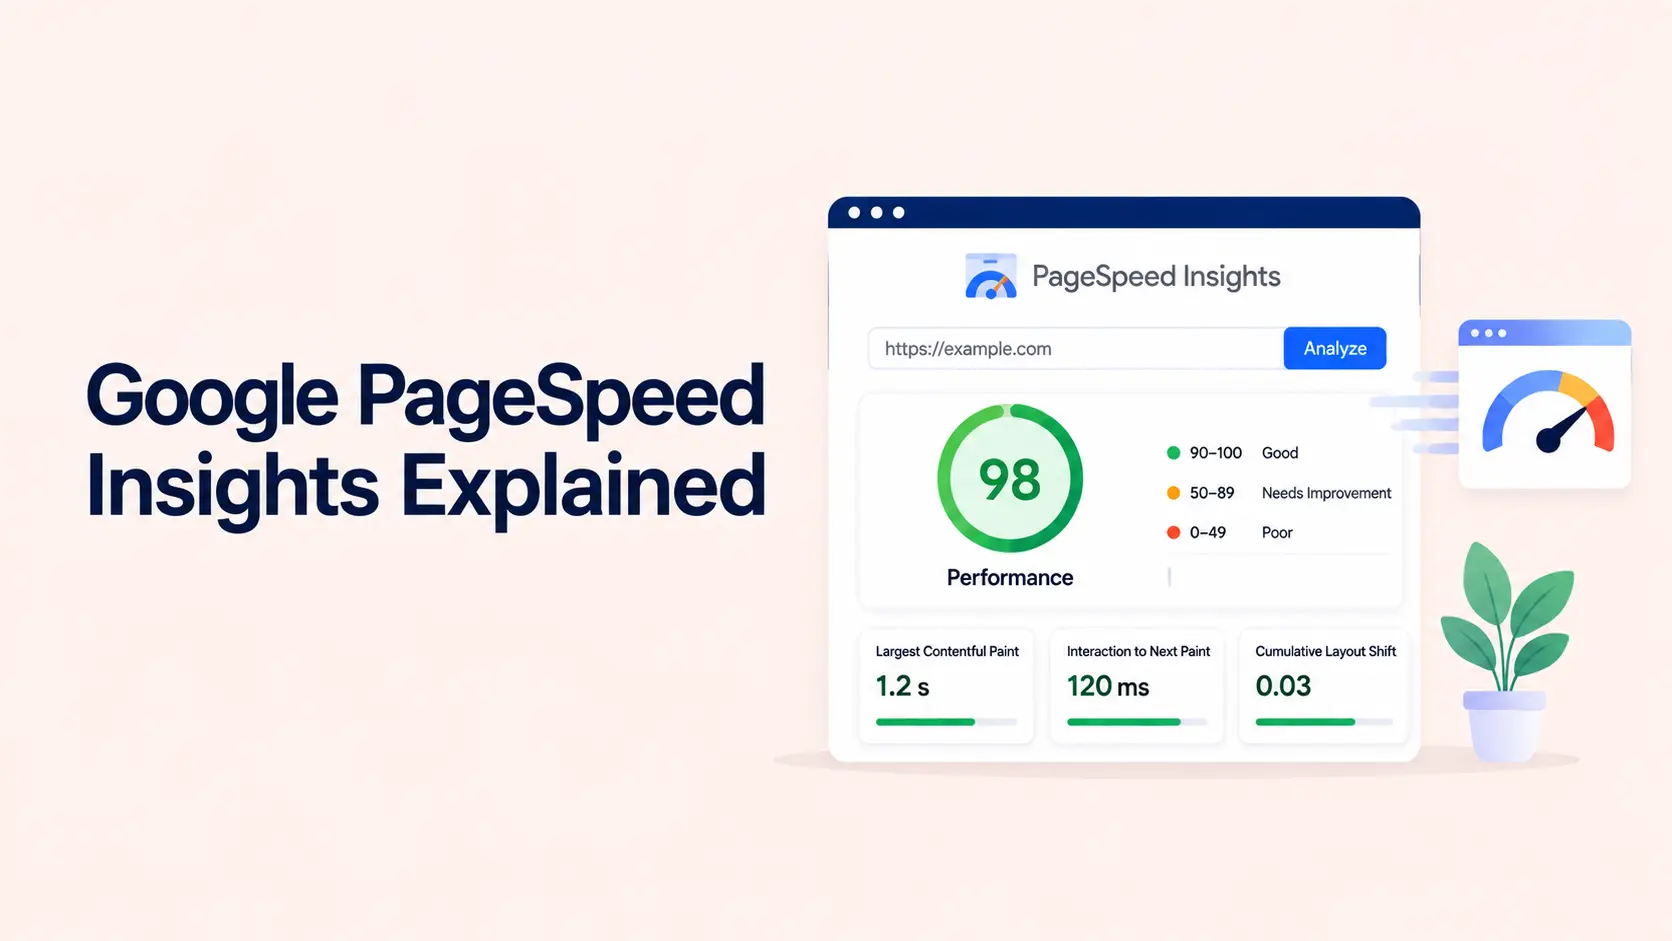
The large 0–100 number in the lab section is the Lighthouse Performance score.
The color ranges are:
- 90–100: Good
- 50–89: Needs improvement
- 0–49: Poor
A 100 is not a requirement. Google’s Lighthouse documentation explicitly notes that achieving a perfect 100 is difficult and not expected.
The score is a weighted combination of lab metrics. Lighthouse 13 did not change the performance-scoring formula; it mainly consolidated older performance audits into newer Insights.
The current metric weights are:
| Lighthouse metric | Weight |
|---|---|
| First Contentful Paint (FCP) | 10% |
| Speed Index | 10% |
| Largest Contentful Paint (LCP) | 25% |
| Total Blocking Time (TBT) | 30% |
| Cumulative Layout Shift (CLS) | 25% |
That weighting explains why a large TBT or poor LCP can move the overall score far more than a small change in FCP.
Importantly, the individual audit warnings themselves do not directly add or subtract points. They matter because fixing them may improve the metrics that feed the score.
How to Read the Lighthouse Metrics
First Contentful Paint (FCP)
FCP measures when the browser first renders visible content such as text, an image, or another page element.
A slow FCP often points toward server delay, render-blocking resources, connection setup, or a heavy initial rendering path.
Speed Index
Speed Index estimates how quickly visible page content appears during loading. It looks at visual progression rather than a single element.
Treat it as supporting diagnostic information rather than a business KPI.
Largest Contentful Paint (LCP)
LCP measures when the largest visible content element in the initial viewport renders. This is commonly a hero image, heading block, banner, or large text area.
If LCP is poor, inspect the actual LCP element before changing anything. Its delay may come from slow server response, late resource discovery, an oversized image, render-blocking CSS, JavaScript, or delayed rendering.
Total Blocking Time (TBT)
TBT measures how much main-thread blocking occurs between FCP and Time to Interactive during the Lighthouse lab run.
Long JavaScript tasks are a common cause. Heavy page builders, analytics scripts, tag managers, widgets, consent tools, sliders, and third-party marketing code can all contribute.
TBT has the largest weighting in the Lighthouse performance score at 30%.
Cumulative Layout Shift (CLS)
CLS measures unexpected movement of visible content.
Common causes include images without dimensions, dynamically inserted banners, ads or embeds without reserved space, and font changes that move surrounding content.
Why PageSpeed Shows INP in Field Data but Not the Lab Score
This is a frequent source of confusion.
INP measures the responsiveness of actual interactions throughout a user’s visit. A synthetic Lighthouse page load cannot reproduce every tap, click, keyboard interaction, menu action, filter, form step, or dynamic UI operation a real visitor might trigger.
For that reason, PageSpeed Insights reports INP from CrUX field data, while Lighthouse uses TBT as an important lab diagnostic for main-thread blocking.
TBT and INP are related, but they are not interchangeable. A low TBT is encouraging, yet a real interaction can still produce poor INP if a particular event handler or UI action performs expensive work.
How to Read the Insights and Diagnostics
Older tutorials often tell you to scroll directly to “Opportunities.” Current Lighthouse versions have consolidated many older audits into broader performance Insights. Exact labels can evolve as Lighthouse changes, so focus on the underlying problem rather than the audit name.
Useful insights can identify issues such as:
- render-blocking resources;
- slow document/server response;
- inefficient image delivery;
- late LCP resource discovery;
- long network dependency chains;
- excessive DOM size;
- duplicated or unused JavaScript;
- third-party code;
- layout-shift causes.
Do not work from top to bottom blindly. An insight is valuable when it explains a weak metric or a confirmed user-experience problem.
For example, if field LCP is poor and Lighthouse identifies a late-loading hero image as the LCP element, that is a high-priority connection. If Lighthouse flags a small unused CSS file while real-user metrics are already strong, that may be low priority.
Why Mobile and Desktop Scores Can Be So Different
PageSpeed Insights runs separate mobile and desktop tests. Mobile testing is deliberately more constrained, so mobile scores are often lower.
Real mobile devices can also have slower processors, variable network conditions, higher latency, and less memory. JavaScript that appears harmless on a powerful desktop can become expensive on a mid-range phone.
Do not “average” mobile and desktop scores. Optimize each experience based on the traffic and problems that matter to your users.
If most customers arrive on mobile, a 98 desktop score does not compensate for poor mobile LCP or INP.
Why Your PageSpeed Score Changes Between Tests
A Lighthouse score is not perfectly deterministic.
Google documents several sources of variability, including network routing, different test conditions, A/B tests, advertisements, device differences, browser extensions, and other environmental factors.
Your own page can also vary because of:
- uncached versus cached requests;
- CDN edge location;
- server load;
- rotating ads or embeds;
- third-party API response time;
- dynamic personalization;
- tag-manager behavior;
- background activity.
Run several tests before concluding that a one-point or five-point change represents a real improvement or regression.
How to Improve a PageSpeed Insights Score the Right Way
The fastest route to a better score is to improve the metric creating the biggest weighted problem, but the best business approach starts with field performance.
1. Start with Core Web Vitals field data
If real users already pass LCP, INP, and CLS, do not rebuild the site solely because one Lighthouse run scored 84.
If field data fails, identify which metric fails and on which device type.
2. Fix slow server response before polishing front-end details
A slow initial document delays almost everything that follows. Improve hosting, application processing, full-page caching, database work, and backend bottlenecks before spending hours shaving a few kilobytes from minor CSS.
3. Optimize the actual LCP element
Find the LCP element in the report. If it is an image, make it appropriately sized and compressed, ensure it is discoverable early, and avoid lazy-loading it when it is immediately visible above the fold.
If LCP is text, inspect fonts, server delay, render-blocking CSS, and client-side rendering.
4. Reduce main-thread blocking
When TBT is high, inspect JavaScript execution rather than installing another generic “speed” feature.
Remove unnecessary scripts, break up long tasks, delay non-critical third-party code, reduce duplicated libraries, and avoid shipping large JavaScript bundles to pages that do not need them.
5. Fix layout shifts at the source
Reserve space for images, videos, ads, embeds, cookie notices, banners, and dynamic components. Avoid injecting content above existing content after the page starts rendering.
6. Remove render-blocking work that matters
Critical CSS should reach the browser quickly. Non-critical styles and scripts should not delay the initial viewport unnecessarily.
Do not defer resources blindly. Moving a file later can fix one audit and break rendering, tracking, accessibility, or interaction behavior.
7. Optimize images based on how they are used
Serve appropriately sized images, use modern compression/formats where suitable, and lazy-load below-the-fold media. Do not serve a 2500-pixel image into a small 400-pixel card.
8. Control third-party scripts
Chat widgets, analytics, advertising, social embeds, review widgets, A/B testing, heatmaps, and consent platforms can add network and main-thread cost.
Ask whether each third-party script earns its performance budget.
9. Re-test the same URL under comparable conditions
After each meaningful change, run several tests and compare the relevant metrics—not only the overall score.
Tenfic’s broader website speed optimization guide covers the server, caching, media, code, CDN, database, and third-party improvements behind these metrics.
WordPress: How to Use PageSpeed Insights Without Chasing Plugins
On WordPress, PageSpeed warnings often tempt site owners to install another optimization plugin for every audit.
That can make the stack harder to understand.
Start by identifying which layer owns the problem:
- hosting/server;
- theme or page builder;
- a specific plugin;
- images or fonts;
- caching configuration;
- third-party scripts;
- custom code;
- WooCommerce or other dynamic functionality.
If JavaScript or CSS is heavy, determine which plugin or theme component creates it. If TTFB is poor, investigate backend processing and caching. If CLS comes from a popup or consent banner, fix that component instead of enabling unrelated optimization settings.
The same principle applies to plugin count. As explained in Tenfic’s guide on how many WordPress plugins are too many, the workload and quality of each extension matter more than the raw number installed.
Does a Higher PageSpeed Score Improve SEO?
Do not treat the Lighthouse 0–100 score as an SEO score.
Google’s current Search documentation says its ranking systems use Core Web Vitals as part of broader page-experience considerations, but it also warns against chasing perfect scores purely for SEO. Relevant, helpful content remains more important than turning a 95 into a 100.
The practical SEO goal is to provide a strong user experience and achieve good real-world Core Web Vitals, not to maximize an isolated lab number.
See Google’s current page experience guidance and Tenfic’s WordPress SEO checklist for the wider technical context.
Common PageSpeed Insights Mistakes
Chasing 100 at any cost
A perfect Lighthouse score can require work with little user or business impact. Fix material bottlenecks first.
Treating one test as truth
Lab conditions vary. Compare multiple runs and validate against field data.
Ignoring field data because the lab score is green
A 95 Lighthouse score does not override poor real-user LCP, INP, or CLS.
Optimizing every warning
Not every diagnostic deserves equal engineering time. Connect each recommendation to a weak metric or real business problem.
Breaking functionality to improve the score
Aggressive script delay, CSS removal, lazy loading, or cache settings can break forms, menus, checkout, analytics, accessibility, and tracking. Performance changes need functional testing.
A Practical PageSpeed Insights Workflow
Use this sequence whenever you test a page:
- Test the exact URL on mobile and desktop.
- Check whether real-user Core Web Vitals data is available.
- Identify the failing field metric: LCP, INP, or CLS.
- Review Lighthouse lab metrics and find the closest diagnostic explanation.
- Inspect the actual element, script, request, or component responsible.
- Make one meaningful change at a time.
- Retest several times under comparable conditions.
- Monitor field data over time because CrUX reflects a rolling historical window rather than an instant post-deployment result.
That workflow turns PageSpeed Insights from a score generator into a useful debugging system.
Conclusion
PageSpeed Insights is most useful when you stop asking “How do I get 100?” and start asking “Which users are having a problem, which metric describes it, and what resource or component is causing it?”
Use CrUX field data to judge real-user performance. Use Lighthouse to reproduce and diagnose technical bottlenecks. Prioritize LCP, responsiveness, and layout stability based on measurable impact, then verify that your changes improve the actual metric without breaking the site.
A better score is useful when it represents a better experience. The experience—not the number—is the target.
Frequently Asked Questions
What is a good Google PageSpeed Insights score?
For the Lighthouse lab performance score, 90–100 is classified as good, 50–89 needs improvement, and 0–49 is poor. The score should be interpreted alongside real-user Core Web Vitals rather than used by itself.
Why is my PageSpeed mobile score lower than desktop?
Mobile Lighthouse testing uses more constrained conditions, and real phones generally have less processing power and more variable networks. JavaScript, images, fonts, and server delays can therefore have a larger impact on mobile.
Why does my PageSpeed score change every time I test?
Lab tests can vary because of network routing, server load, caching, third-party scripts, ads, and other environmental conditions. Run multiple tests and look for consistent metric changes rather than reacting to one score.
What is the difference between PageSpeed Insights and Lighthouse?
Lighthouse is the lab auditing engine used for the synthetic part of PageSpeed Insights. PageSpeed Insights adds CrUX real-user data when available, so it combines field evidence with Lighthouse diagnostics.
Does PageSpeed Insights measure INP in the lab?
No. INP is a field metric based on real user interactions. Lighthouse reports Total Blocking Time as a lab metric that helps identify main-thread blocking, but TBT is not the same metric as INP.
Is a 100 PageSpeed score necessary for SEO?
No. Google recommends good Core Web Vitals and a strong overall page experience, but a perfect Lighthouse score is not required. Improving content usefulness and meaningful user experience is more important than chasing the last few lab points.
How long does it take PageSpeed field data to improve after optimization?
CrUX field data represents a rolling 28-day collection period, so it does not update immediately after a deployment. Lab results can reflect a technical change right away, while field improvements appear as new real-user data enters the reporting window.